Constructing the ATLAS portfolio
- Mansa Kumar
- Dec 9, 2025
- 9 min read

Updated: Dec 15, 2025

The ATLAS portfolio was my first portfolio construction project designed with a singular objective: to provide a long-term capital growth solution for U.S citizens residing in the UK. The portfolio's core mandate was to deliver compelling returns over a minimum 10-year time horizon through a clear and diversified managed investment strategy. The creation of this portfolio is a direct response to the complex financial and regulatory environment faced by this specific client segment. Many UK-based Americans find themselves effectively "frozen out" of traditional investment vehicles due to the punitive tax and reporting requirements imposed by both U.S. and UK regulatory bodies. By structuring the portfolio's underlying holdings as direct shares or fractional shares, it was possible to bypass the burdensome Passive Foreign Investment Company (PFIC) and Offshore Income Gains (OIG) regimes.
Thematic Approach to Investing
A notable development in market dynamics is the increasing concentration of market-cap-weighted indices. For example, the 10 largest companies in the S&P 500 (index of 500 large U.S. companies) now drive almost 40% of its performance and moreover, technology firms make up 35% of the index. This exposes the portfolio to heightened specific risk, making the index less diversified than its sheer number of components would suggest.
The core-satellite investment approach is a "best-of-both-worlds" strategy that combines the stability, cost efficiency, and tax advantages of passive, index-based investing with the potential for outperformance from active, targeted allocations. The core serves as the stable, long-term foundation, providing exposure to market beta, while the satellites are designed to generate returns by targeting specific market trends, sectors, or inefficiencies.

Quantitative Screening Framework

Sector ETF Screening
The ATLAS Portfolio's construction began with a comprehensive quantitative screening of exchange-traded funds (ETFs) across 25 distinct market sectors, The screening process utilised a multi-factor evaluation framework that examined over 70 potential ETFs, analysing five years of daily return data to establish robust performance metrics and correlation structures. For each sector category, I evaluated between 3-5 primary ETF alternatives, ultimately selecting the single best-performing vehicle based on a composite scoring methodology that weighted risk-adjusted returns (40%), liquidity metrics (20%), tracking efficiency (20%), and expense ratios (20%).
Correlation Analysis for Diversification Optimisation
The Sector Correlation Matrix below reveals the intricate interdependencies across the investment universe, with correlation coefficients identifying critical diversification opportunities within the portfolio structure. Low Correlation Pairs (<0.30): Energy-Utilities (-0.15), Real Estate-Technology (0.25), providing natural hedges while High Correlation Clusters (>0.75): Consumer sectors, Technology-Semiconductors, indicate redundancy risks. The heatmap's predominantly red coloration (correlations >0.50) underscores the challenge of achieving true diversification in modern markets, where systemic factors increasingly drive cross-sector performance. This finding validated the decision to implement a core-satellite structure, where tactical satellite positions in less correlated sectors (Energy, Utilities, Real Estate) can provide meaningful portfolio diversification beyond what traditional equity exposure offers.

The Risk-Return Profile plots each sector's annualised return against volatility, with the colour gradient representing Sharpe ratios (risk-adjusted performance). This visualisation enabled systematic identification of sectors offering superior risk-adjusted returns. Energy presents an attractive diversification opportunity with high returns despite high volatility. Banks, Insurance, and Software Services emerge as defensive sectors with medium volatility and above-average returns. This risk-return distribution validates the sector selection methodology, clearly delineating between high-conviction growth opportunities and sectors requiring tactical avoidance. This systematic screening process ensures that each position within the ATLAS Portfolio represents the optimal vehicle for capturing sector-specific returns.
Quantitative Projection Framework
The ATLAS Portfolio employs a multi-horizon sector projection framework that generates forward looking return expectations across 25 distinct sector allocations seven strategic time horizons (3 months to 10 years), enabling dynamic positioning that balances near-term momentum opportunities with long-term strategic themes. This quantitative methodology underpins tactical asset allocation decisions and provides the analytical foundation for optimising the portfolio's core-satellite structure. The projection methodology utilises a “weighted ensemble approach” that combines five complementary quantitative models, each capturing distinct market dynamics.
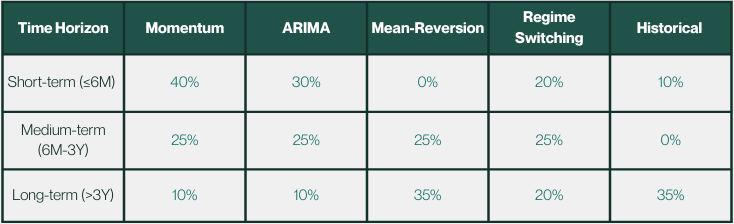
This dynamic weighting scheme reflects empirical evidence that momentum factors dominate short-term returns, while mean reversion and historical fundamentals assert greater influence over extended horizons. For component level specifications see Appendix 1.

Short-term to Long-term - Comprehensive sector rotation analysis displaying expected returns across investment horizons from 3 months to 10 years for 25 distinct market sectors. Box plots illustrate median returns (horizontal line), interquartile ranges (boxes), and volatility bands (whiskers) with dashed reference lines indicating sector neutral positioning. Notable patterns include defensive resilience in Insurance, cyclical opportunity in Banks and Energy. This granular decomposition informs the tactical sector rotation framework whilst validating core thematic allocations within the ATLAS Portfolio construction.
Investment Research: Sector Specific Rationale
Capital Goods & Defence: The Rearmament Supercycle
Purpose: To capture the multi-decade government-led investment supercycle driven by persistent geopolitical instability and renewed national security imperatives.
Rationale: Global defence spending surged 8.1% in 2024 to $2.3 trillion, with Germany tripling its defence budget by 2029 and NATO members accelerating procurement schedules. This structural shift toward "strategic autonomy" prioritises domestic suppliers and represents irreversible policy commitments transcending economic cycles.
Benefit to clients: Provides exposure to a non-cyclical, government-backed revenue stream with exceptional visibility, offering portfolio resilience during market volatility while capturing asymmetric upside from sustained capital expenditure acceleration.
Energy Transition: The Mandated Transformation
Purpose: To position for the irreversible, policy-mandated energy transition with clear regulatory pathways and committed capital deployment schedules.
Rationale: The EU's binding 2035 combustion engine ban and €477 billion annual green investment requirement creates a €1.2 trillion yearly opportunity. EU-27 renewable investment surged 63% in H1 2025 whilst U.S. investment fell 36%, signaling strategic capital reallocation to Europe's policy framework.
Benefit to clients: Captures regulatory-driven alpha from European companies directly benefiting from policy-mandated capital flows, providing both growth potential and ESG alignment without sacrificing returns.
Insurance: Defensive Resilience
Purpose: To anchor the portfolio with non-cyclical, cash-generative defensive exposure that thrives across economic regimes.
Rationale: Structural tailwinds from ageing demographics (global dependency ratio rising significantly by 2050) and climate risk acceleration enable sustained premium increases. P&C insurers capitalise on increasing climate event frequency whilst life/health segments benefit from demographic inevitability.
Benefit to clients: Delivers consistent income generation and capital preservation during market stress, whilst maintaining upside participation through pricing power and structural demand drivers immune to economic cycles.
Banking & Financials: Structural Re-rating
Purpose: To exploit the cyclical recovery transitioning into permanent structural re-rating as monetary normalisation becomes entrenched.
Rationale: Sustained higher interest rates create a new normal for Net Interest Margins, with European banks demonstrating superior "stickiness phenomenon"-interest income adjusting faster than expenses during tightening. This asymmetric sensitivity to policy shifts directly amplifies income statements beyond temporary cyclical gains.
Benefit to clients: Provides leveraged exposure to monetary policy normalisation with enhanced earnings visibility, capturing both the immediate NIM expansion and longer-term valuation re-rating as the sector's structural profitability reset becomes recognised by markets.
Shortlisted Sector Analysis
Risk-Return Scatter Profile
The risk-return scatter analysis reveals critical insights into our efficient frontier positioning. Capital Goods and Finance sectors occupy the optimal northwest quadrant, delivering superior risk-adjusted returns with annualised volatilities contained within the 20-40% range while generating returns exceeding 40%. This validates the conviction in these core satellites. The positive risk-return relationship (indicated by the trend line) suggests market efficiency remains intact, supporting the quantitative screening framework. Technology positions exhibit wider dispersion, necessitating rigorous fundamental overlay to identify quality compounders within the high volatility cohort. Insurance sector positions cluster in the lower volatility spectrum, providing essential portfolio stabilisation while maintaining positive expected returns-critical for managing maximum drawdown constraints.

Momentum Scoring Framework
Technology and Finance sectors demonstrate exceptional momentum characteristics at 26.2% and 23.9% respectively, validating the overweight positioning in these growth themes. The Capital Goods sector's robust 21.4% momentum score aligns perfectly with the Defense & Infrastructure satellite allocation. The negative momentum in Healthcare (-3.4%) reinforces the tactical exclusion, as the sector faces persistent headwinds from drug pricing reforms and post-pandemic normalisation dynamics.

Market Cap Rationale
The ATLAS Portfolio's thematic indices employ a market-capitalisation weighting methodology, systematically allocating capital proportionally to constituent market values to capture momentum in sector leaders while mitigating small-cap volatility drag. To validate this construction approach, back-testing was conducted by isolating the top five holdings by weight within each thematic index and comparing performance attribution under the market-cap framework versus an equal-weighted alternative. This concentration analysis confirms that the market-cap methodology successfully harvests the quality factor premium inherent in large-cap dominance while maintaining superior risk-adjusted returns. The cumulative performance trajectories demonstrate compelling outperformance dynamics across thematic allocations. Notably, these strategies have materially outperformed the S&P 500 benchmark since 2023, capturing the structural alpha from identified megatrends. The Insurance and Financials allocations provide essential portfolio ballast with lower volatility profiles while maintaining positive absolute returns, confirming their role as defensive anchors.

Risk Management
Drawdown Analysis
The historical drawdown profile underscores the portfolio's resilience through market stress scenarios. The 2020-2021 maximum drawdown of approximately 40% during the pandemic shock has informed the current risk budgeting framework, leading to enhanced diversification across uncorrelated thematics. The subsequent recovery trajectory demonstrates the portfolio's inherent mean-reversion characteristics and validates the systematic rebalancing methodology. Current drawdown levels near historical lows suggest favorable risk taking conditions, supporting the strategic decision to maintain higher equity exposure while implementing dynamic hedging overlays. The stability exhibited from 2024 forward reflects the maturation of the risk management framework and improved sector correlation dynamics.
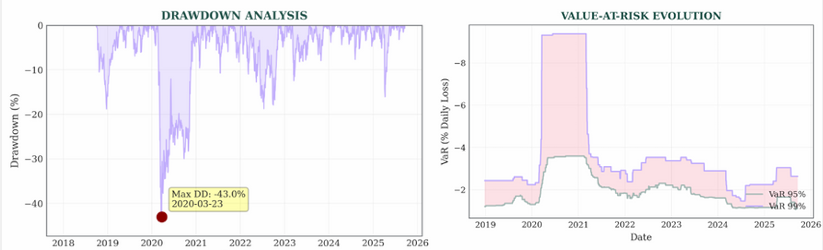
VAR Evolution
The ATLAS Portfolio's Value-at-Risk evolution shows the pandemic-era spike at -9% (95% confidence) which serves as a critical recalibration event that now anchors the stress testing framework. The subsequent normalisation to a stable -2% to -3% VaR band validates the diversification strategy and dynamic hedging overlays, while the tight 100 basis point spread between 95% and 99% confidence intervals confirms well-behaved tail risk characteristics without hidden leverage. The modest late-2025 uptick signals potential volatility regime transition, supporting the tactical implementation of asymmetric hedges through Energy and Insurance exposures that provide negative correlation during risk-off episodes, positioning the portfolio to capture upside from high-conviction themes while maintaining downside protection.
ATLAS Portfolio Component Impact Matrix
Stress testing framework illustrating portfolio sensitivity across five critical risk scenarios. The matrix quantifies expected performance impact (%) for each thematic allocation under tail risk events including Federal Reserve tightening (+200 basis points), AI valuation correction, geopolitical escalation, inflationary shock (>5%), and China growth deceleration. Colour intensity represents impact magnitude, with defensive allocations (Insurance, Cash) demonstrating resilience whilst growth themes (Energy, Banking) exhibit heightened sensitivity to macro shocks. This comprehensive scenario analysis validates the diversification framework and informs dynamic hedging overlays to optimise risk-adjusted returns across market regimes.

Benchmarking Portfolio
The selection of benchmarks is critical for a transparent assessment of performance. The portfolio is measured against two key benchmarks: the ARC Sterling Equity Risk PCI and UK CPI +5%.
The ARC Sterling Equity Risk PCI is not a generic market index but a risk-based, peer-group benchmark. It is calculated using actual, net-of-fee performance data from participating investment managers and classifies portfolios based on their historical relative risk to world equities. This is a professional standard for performance measurement, as it ensures that the portfolio is being assessed against its most relevant peer set-discretionary portfolios with a similar risk mandate-rather than a passive, non-specialist index.
The UK CPI +5% benchmark provides a measure of the portfolio’s "real return". By targeting returns that are a significant premium above inflation, the portfolio’s objective is to not only grow the client’s capital but to meaningfully increase their purchasing power over time. This is a crucial benchmark for clients whose primary concern is the long-term preservation and growth of their wealth in real terms.

Monte Carlo Projection
Monte Carlo Projection (5-Year) is a stochastic simulation framework projecting ATLAS Portfolio value evolution over a 5-year investment horizon using 10,000 Monte Carlo iterations. The median trajectory (dark line) indicates expected portfolio multiple of 1.8x initial capital, whilst confidence bands capture outcome distributions at 50% (dark grey) and 90% (light grey) probability levels. Geometric mean expectation (dashed line) demonstrates positive skewness in return distribution. The widening confidence intervals reflect compounding uncertainty whilst maintaining positive expected value across all scenarios, validating the portfolio's risk-return profile for long-term wealth accumulation.

Appendix: Quantitative Sector Forecasting Framework
Momentum Model
Captures trend persistence through exponentially weighted moving averages, particularly effective in identifying sectors experiencing sustained capital flows. The model applies a half-life of 21 trading days, calibrated to balance responsiveness with stability.
ARIMA Framework
Implements autoregressive integrated moving average modeling with parameters optimised through maximum likelihood estimation. This component excels at capturing cyclical patterns and short-term mean reversion dynamics within broader trend structures.
Mean Reversion Model
Employs an Ornstein-Uhlenbeck process calibrated to each sector's historical characteristics, projecting convergence toward long-term equilibrium levels. The mean reversion speed parameter (κ) is estimated using maximum likelihood methods on rolling 5-year windows.
Regime Switching Framework
Utilises a three-state Hidden Markov Model to identify prevailing market conditions (Bull/Base/Bear), with transition probabilities derived from historical regime persistence patterns. Sector returns are adjusted based on their historical sensitivity to each regime state.
Historical Baseline
Provides stability through incorporation of long-term historical returns, with appropriate adjustments for structural changes and secular trends affecting individual sectors.
Risk Quantification and Confidence Intervals
Each projection incorporates comprehensive uncertainty quantification through:
Confidence Bands: ±1 standard deviation intervals displayed as error bars, calculated using both historical volatility and model uncertainty
Volatility Scaling: Projections adjusted for current implied volatility relative to historical realised volatility
Correlation Adjustments: Cross-sector dependencies incorporated to ensure portfolio-level consistency
Validation and Quality Assurance
Triple-Layer Validation Protocol:
Out-of-Sample Testing: Rolling window cross-validation with 60-month training periods
Back-testing Verification: Mean Absolute Error (MAE) and Root Mean Square Error (RMSE) tracked across all projections
Monte Carlo Stress Testing: 10,000 scenarios per sector to establish robust confidence intervals
Disclosure and Limitations
While the framework represents best practices in quantitative forecasting, all projections are subject to model risk and parameter uncertainty. Historical relationships may not persist, particularly during regime changes or unprecedented market conditions. The ensemble approach mitigates but cannot eliminate these inherent limitations. Actual returns will deviate from projections, and past model performance does not guarantee future accuracy.


Comments